A certified appraiser’s data-driven look at what actually happened across five Phoenix-area ZIP codes, and what it means heading into 2027
Most people checking in on the market at year-end want a single-sentence answer: did prices go up or down? The honest answer for 2026 is neither. Across the five sales markets and three rental markets we tracked this year, the dominant story was stability — not the headline-grabbing kind, but the kind that actually shows up when you run the numbers against a real statistical test. That is a more useful finding than any single-direction summary, and it changes what buyers, sellers, renters, and landlords should plan around going into 2027.
The five sales markets at a glance
We tracked closed sales in five ZIP codes that together span the range of Phoenix-area housing: Scottsdale 85250, Phoenix/Desert Hills 85086, Wittmann 85361, Surprise 85387, and Mesa 85212. Each market has its own character. Scottsdale 85250 is the oldest housing stock in the set — the typical home sold there in 2026 was built in 1970 — and nearly two-thirds came with a private pool. Phoenix/Desert Hills 85086 sold the largest homes, with a typical sold home of 2,818 square feet, and the longest marketing time. Wittmann 85361 and Surprise 85387 were dominated by new construction, with 2025–2026 median build years and buyer pools heavily weighted toward FHA and VA financing. Mesa 85212 sits in the middle — recent-build area, strong 2026 velocity, and the kind of family-oriented buyer profile the East Valley is known for.
[Refresh each ZIP profile (typical build year, size, pool share) with final 11-month data.]
The year in one chart
Here is what median price-per-square-foot looked like month by month across all five markets. The lines move. But movement alone does not mean a trend — random month-to-month noise can look dramatic in a small chart and vanish under statistical testing.
When we ran a proper trend regression on each market, none of the five crossed the threshold that would support calling 2026 either a rising or falling year. The movement you see is real; the direction is not statistically distinguishable from stable. For buyers, that means the market was not slipping away — and for sellers, it means the market was not doing their work for them either. Both sides had time to think.
That conclusion does not rest on our data alone. Two independent sources point the same way. The Federal Housing Finance Agency’s house price index showed the Mountain region, which includes Arizona, up just 0.5 percent year over year through August 2026, the weakest reading of any region in the country. ARMLS marketwide figures, drawn from a far larger pool than our five ZIPs, showed a median sale price essentially flat year over year by September. When neighborhood-level regressions, a federal price index, and the regional MLS all land on the same word, stability is not a hedge. It is the finding.
[Re-run all five regressions on 11-month data and confirm each still tests as statistically stable before keeping this conclusion.]
How fast homes sold
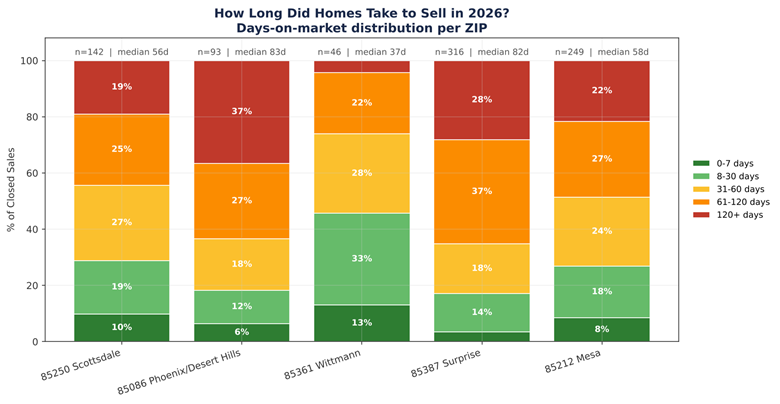
Days on market tells a different story in each ZIP. Wittmann closed fastest — nearly 40 percent of homes there sold in under a month, consistent with the new-construction tempo and simpler buyer-decision cycle. Phoenix/Desert Hills and Surprise sat on the market longer; their median home needed over two months to find a buyer. For sellers, the honest read is that most 2026 markets required patience, not panic pricing.
[Update days-on-market figures with November closings.]
What sellers actually got at the table
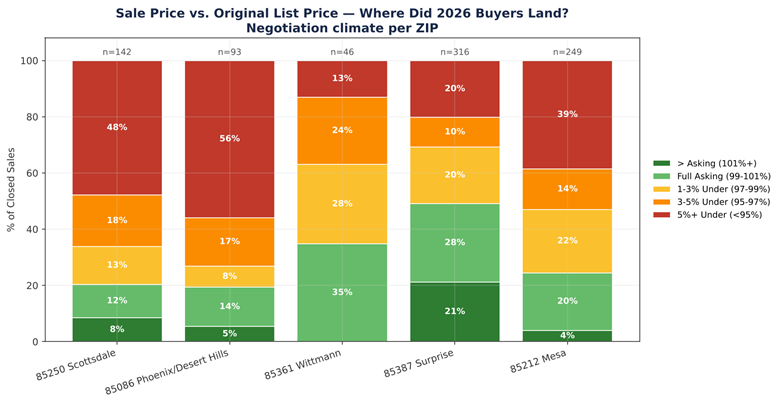
The chart below compares each ZIP’s closed sale price to its original asking price. This is one of the clearest pictures of negotiation climate you can build from MLS data. Surprise sellers held closest to asking — nearly 98 cents on the dollar on average — while Scottsdale and Phoenix/Desert Hills sellers typically gave up more ground. If you listed a home in those markets in 2026 and received an offer that was three to five percent under your ask, you were in the majority, not the exception.
[Update sale-to-original-list ratios with November data.]
Who was buying
Financing patterns separate these markets as sharply as price does. In Phoenix/Desert Hills 85086, one in three closed sales was all cash. In Wittmann and Surprise, FHA and VA loans together financed well over half of all closings — a signature of entry-level and first-time buyer activity. That distinction matters for anyone selling in either type of market: the buyer you are negotiating with carries different constraints, different timelines, and different leverage depending on where you sit on this chart.
Note: The 85250 Scottsdale and 85212 Mesa exports used an abbreviated ARMLS format that did not include the field we need for actual loan type, so those two ZIPs are not shown on this chart. The sales-price and DOM figures for those markets elsewhere in the post are unaffected.
[Update the financing mix with November data. Re-pull 85250 and 85212 in full ARMLS format if possible so loan type can be shown.]
Inventory, tempo, and the listings that didn’t sell
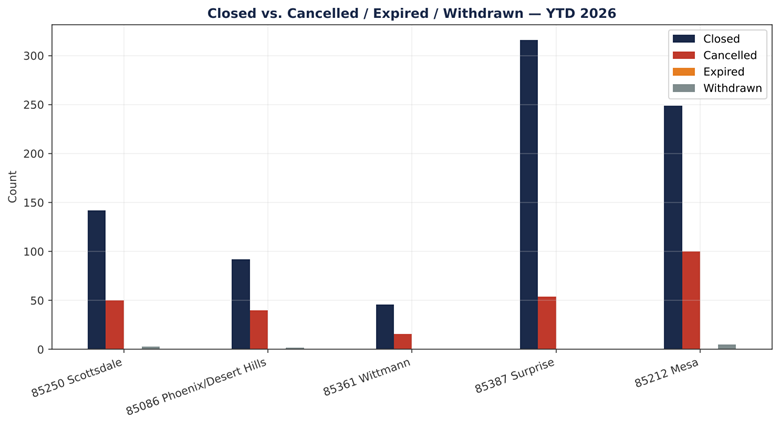
Not every listing closes. A healthy share of 2026 listings came off the market before finding a buyer — cancellations and withdrawals rather than closings. Phoenix/Desert Hills had the highest non-close rate at roughly 32 percent, and Surprise the lowest at just under 15 percent. High cancellation rates are often a signal of pricing resistance or seller fatigue; low rates point to healthier buyer-seller alignment on price.
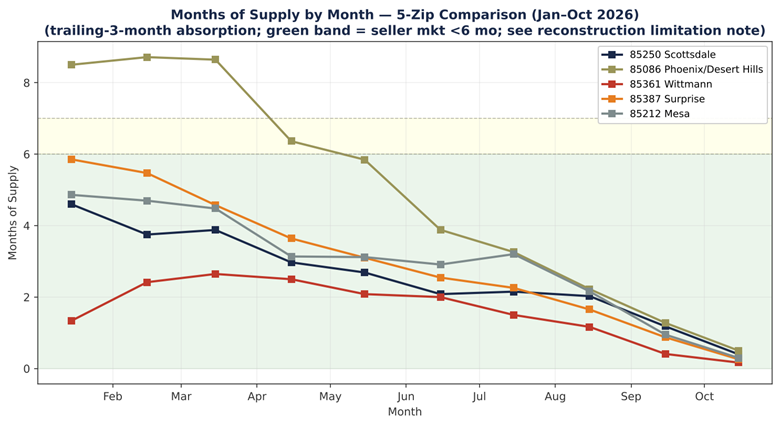
Supply tightened in every market as the year progressed. Months-of-supply — how long it would take to sell everything currently listed at the current sales pace — fell from a balanced-to-buyer-favored range early in the year to a seller-favored range by late summer. Some of that late-year sharpness is a reconstruction artifact (listings that closed or were withdrawn after our data pull are no longer traceable), but the directional pattern is real: absorption outpaced new listings from mid-year forward.
[Update cancellation rates and months-of-supply with November data; re-check the late-year reconstruction caveat once final listings are in.]
The 2026 rental story
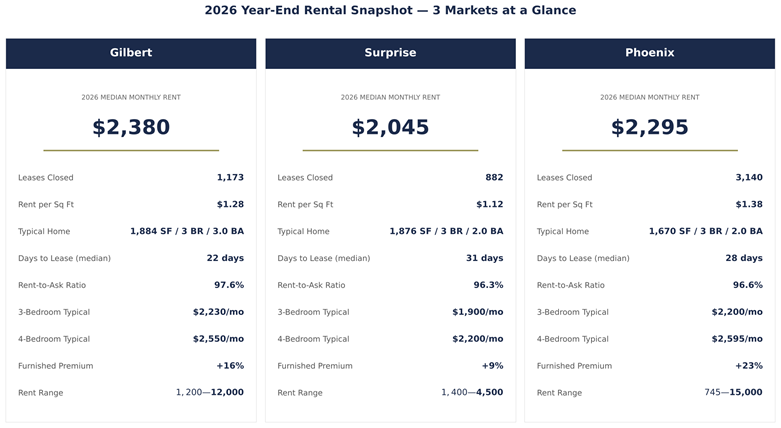
Rentals deserve their own section. Renters and landlords are watching a different set of numbers than buyers and sellers, and 2026 told a story that mirrors the sales market in some ways and diverges in others. We tracked three cities: Gilbert, Surprise, and Phoenix. Almost every lease in these markets was long-term and unfurnished — ninety-seven to ninety-eight percent across all three cities — which is itself a notable finding. Seasonal and short-term rentals barely registered in the MLS data, though plenty of snowbird activity happens outside MLS channels and may not show up here.
What renters paid per square foot
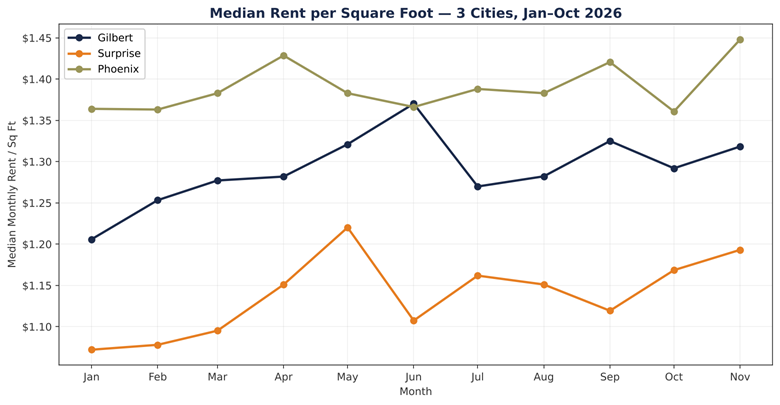
The Phoenix rental market priced the highest on a per-square-foot basis, Gilbert in the middle, and Surprise the lowest — which tracks neatly with each city’s sales price profile and the walkability, transit access, and amenity density that drive rental demand. All three cities held within a stable range through the year, with Surprise showing a technically significant but very small upward drift (under one percent per month), too small to call a rising-rent market.
[Update rent-per-square-foot figures and significance with November leases.]
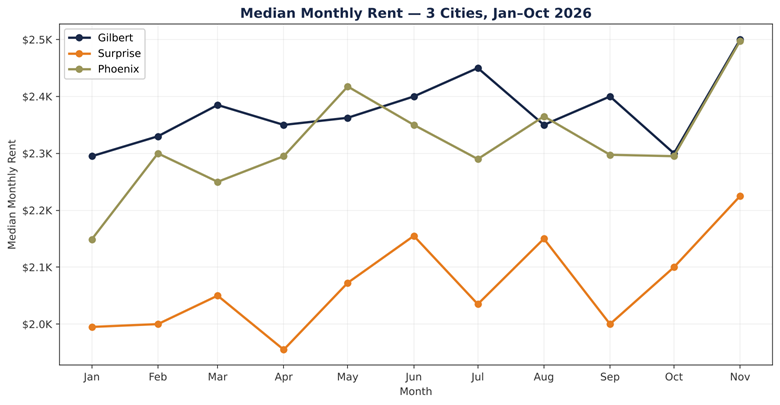
The whole-dollar view of median rent tells the same story in a form renters usually find more intuitive. The typical renter in Gilbert paid about $2,380 a month in 2026. In Phoenix, about $2,295. In Surprise, about $2,045. For renters planning to re-sign in 2027, nothing in this data supports an expectation of dramatic rent hikes. For landlords, the same data says the market will not do the work of raising rents on its own — pricing discipline matters.
[Update median rents (Gilbert, Phoenix, Surprise) with November data.]
How fast homes leased
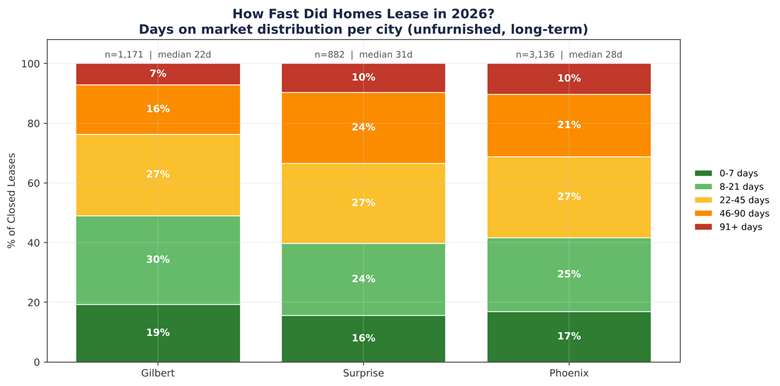
Gilbert was the tightest rental market in the set — the median rental there leased in 22 days, and nearly a third of listings were under lease inside a week. Phoenix and Surprise both ran slightly looser, with median lease-up times just over four weeks. Combined with the 98.8 percent rent-to-asking ratio Gilbert landlords achieved, this is the clearest picture of landlord-favored conditions in the group.
[Update lease-up times with November data.]
The furnished-rental premium
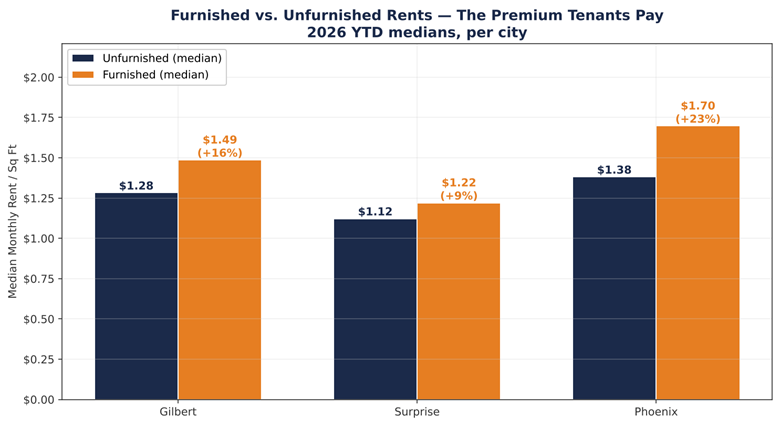
Landlords weighing whether to furnish a rental should look at this chart carefully. Phoenix paid the largest premium for furnished units — twenty-three percent above unfurnished comparables, a difference that is statistically rock-solid. Gilbert paid a sixteen percent premium. Surprise paid only nine percent, and while that difference was statistically significant, the margin may not cover the cost and hassle of furnishing in the first place. The math for furnishing is market-specific.
[Update furnished premiums and significance with November leases.]
Rent by bedroom count
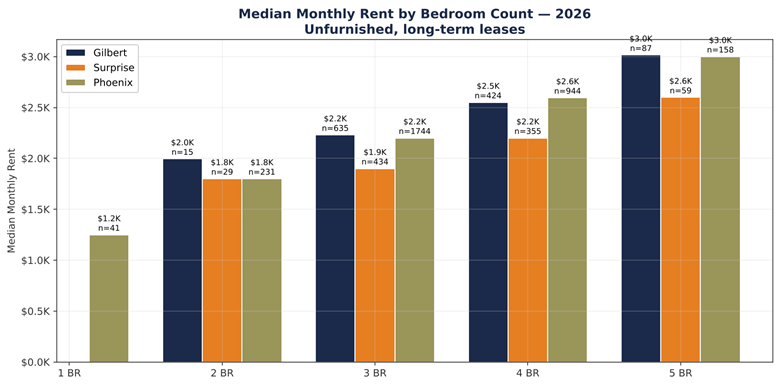
For renters trying to anchor expectations around unit size, the picture is clearer in whole-dollar rent than in per-square-foot terms. A typical three-bedroom in Gilbert went for about $2,400 a month in 2026; in Phoenix about $2,100; in Surprise about $2,000. Four-bedroom homes added roughly $500 to that number. These are medians on hundreds of actual closed leases, not asking prices.
[Update bedroom-level rents with November data.]
The best time to obtain that clarity is before the decision has already been made. Contact LaPlante Appraisals to discuss the property, the purpose of the assignment, and the type of private appraisal you may need.